
To understand Catholic University's environmental impact, campus utilities are analyzed continuously. From there, trends emerge, which provide a clearer picture of how operational changes, the COVID-19 pandemic, and campus-wide projects such as the Energy Project, have an overall impact on energy, water, and waste.
The Facilities Maintenance and Operations (FMO) department has broken down the utility data into water, natural gas, electricity, waste (and recycling), and greenhouse gas emissions and analyzed the data over the past four years (2016-2020). The data for 2020 reflects the impact of the substantial completion of the Energy Project and the reduced campus operations due to the pandemic. To learn more about the Energy Project, read our blog post.
This blog is part of a series uncovering the big picture of how energy, water, and waste is consumed on campus. Part I will focus on water and waste. Part II will include a discussion on energy and greenhouse gas emissions.
Data Anomalies
In 2018, the Energy Project led to the installation of many efficient boilers and chillers. For some time, the new heating, ventilation, and air-conditioning (HVAC) equipment ran concurrently with the older equipment. The stress of running these systems simultaneously resulted in a noticeable increase in energy and water use for that year.
In 2020, the second half of the spring semester was conducted virtually. Staff and faculty began phasing back to campus at 25% during the fall semester. By the year’s end, 600 students resided on campus (two-thirds of residential buildings were operational) and approximately 25% of the staff and faculty were on campus during any given workday. The reduced campus population and operational buildings resulted in a noticeable decrease in energy and water use for that year.
Water
On campus, water is used for faucets, toilets, showers and also to heat and cool buildings on campus. Before the Energy Project, campus buildings used water from the Power Plant to provide heat via steam. Depending on proximity to the Power Plant, a certain amount of steam would be lost in transition by radiation, convection, and conduction. To account for the loss in transit, the Power Plant would have to pump even more steam from the plant.
The Energy Project includes a stormwater harvesting cistern and filtration system to collect rainwater, for use in the three cooling towers. It can hold 15,000 gallons of water, with an expected water savings of 270,226 gallons per year.
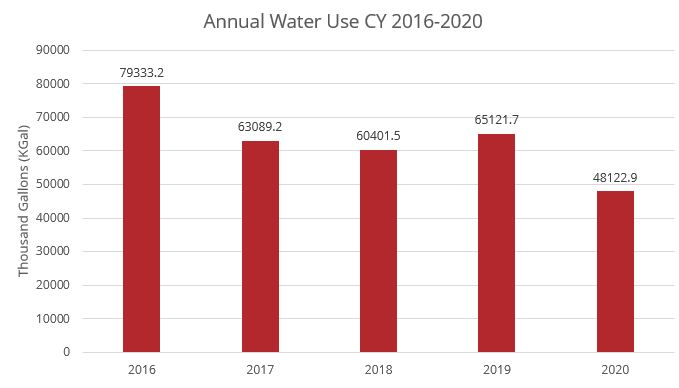
As shown in the graph below, Catholic University has seen significant water savings in 2020. There was a 39% decrease in water use between 2016 and 2020, and a 30% decrease in water use between 2019 and 2020. These savings have translated to cost savings of $131,146 from 2016-2020 and $105,574 from 2019-2020.
Waste
Waste refers to all discarded items removed from the University, including recycling, compost, and trash. The diversion rate is the amount of waste that was recycled or composted versus landfilled. Waste diversion is the key metric when examining recycling progress.
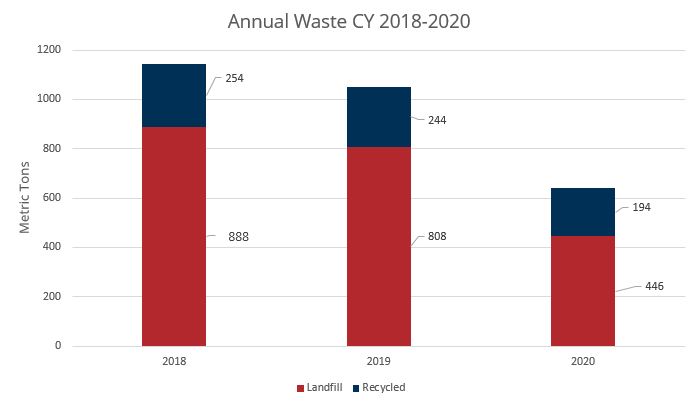
Figure 2: Annual Waste CY 2018-2020
Complete recycling data goes back to 2018. Before 2018, the University used another waste hauler. Total waste from 2018 to 2020 decreased by 44% due to the pandemic. Fewer people were on campus, meaning less waste was generated. The diversion rate has remained around 30% each year. With collaboration between Facilities Administrative Services (FAS), FMO, and the greater University community, recycling will improve.
Impact
In 2020, the University released its 2020 Sustainability Plan, which has new goals to reduce water and waste. FY 2016 is the baseline as this was the last full year of data before the University began construction on the Energy Project. The fiscal year runs from May 1st to April 30th. By FY 2025, the University aspires to reduce:
- Water use by 20%, which is equal to 14,643 kGals saved, which is enough water to fill 22 Olympic-sized swimming pools.
- Waste by 50%, which is equal to 700.36 tons removed from the landfill, which could save 143,048 hours of electricity or 25,871 gallons of oil.