As a best practice, the University monitors its energy usage continuously through utility bills and sub-metering data. Through a practice known as energy benchmarking, the University can track energy and water use to compare current performance against past performance. These comparisons can make the case to pursue big energy efficiency projects such as the Energy Project. This blog is part of a series uncovering the big picture of how energy, water, and waste is consumed on campus. Part II will focus on energy which includes gas and electricity.
Data Anomalies
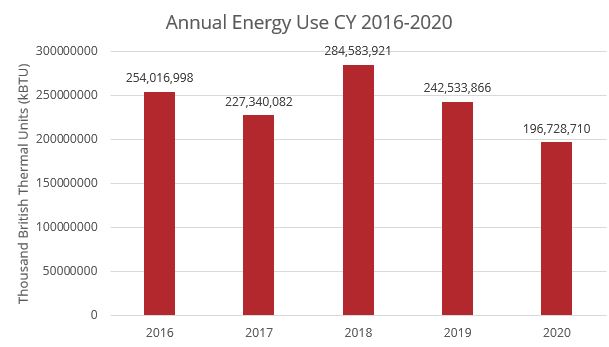
In 2018, the Energy Project was well underway. Many efficient boilers and chillers were installed that year. For a time, however, many of the old HVAC equipment were running concurrently. The stress of running these systems simultaneously was a noticeable increase in energy and water use.
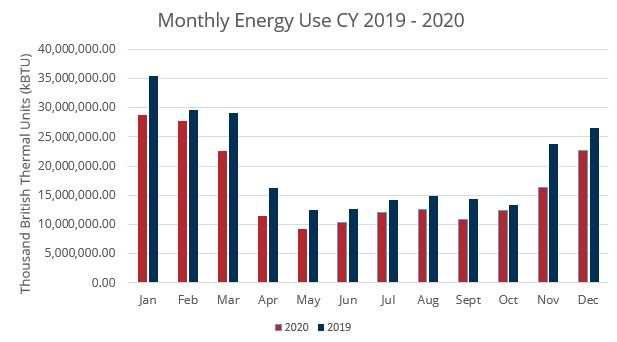
In 2020, the second half of the spring semester was conducted virtually. Staff and faculty began phasing back to campus at 25%. By the year’s end, 600 students resided on campus and approximately 25% of the staff and faculty were on campus during any given workday. 2/3 of residential buildings were operational. The reduced campus population and operating buildings have a noticeable decrease in energy and water use for that year.
Energy
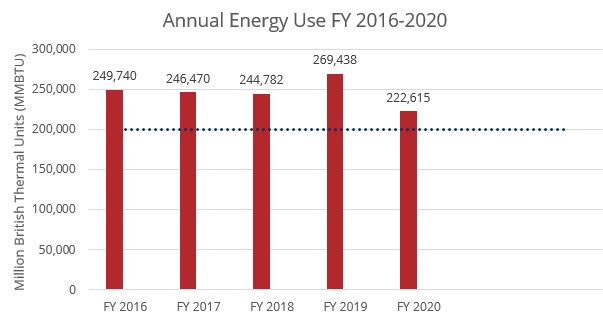
Energy use accounts for the majority of campus utility costs. The energy required to power all heating ventilation and air-condition (HVAC) campus equipment is supplied either through electricity or natural gas. Natural gas is used more for powering the boilers, and other steam system components that warm buildings on campus. Electricity is used primarily for cooling, lighting, and powering general appliances and computers. The graph below displays energy use falling over time from 2016 to 2020.
Energy Use Savings
2020 from 2016
- 22% decrease in energy usage
- $1.09M in savings
2020 from 2019
- 19% decrease in energy usage
- $987,000 in savings
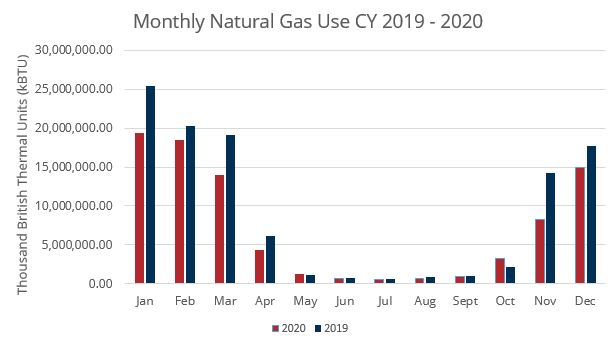
Natural Gas
Natural gas follows a similar trend to the overall energy consumption. Gas usage demand was high for heating in 2016 compared to 2017. 2018’s gas usage is high due to a colder than normal winter and concurrent heating systems running during Phase I of the Energy Project.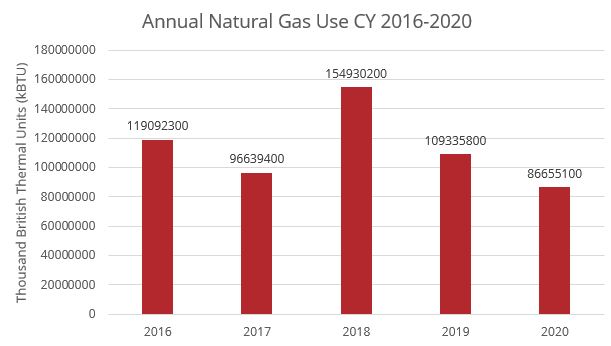
Natural Gas Use Savings
2020 vs 2016
- 27% decrease in natural gas usage
- $194,000 in savings
2020 vs 2019
- 21% decrease in natural gas usage
- $259,000 in savings
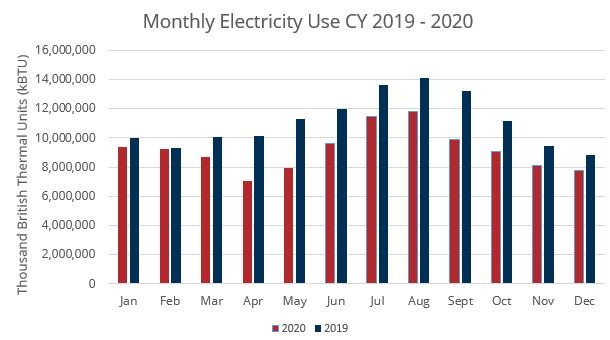
Electricity
Electricity use was steady for years 2016 through 2019. In 2020, electricity use dropped significantly due to the substantial completion of the energy project and low campus population during the Spring, Summer and Fall semesters.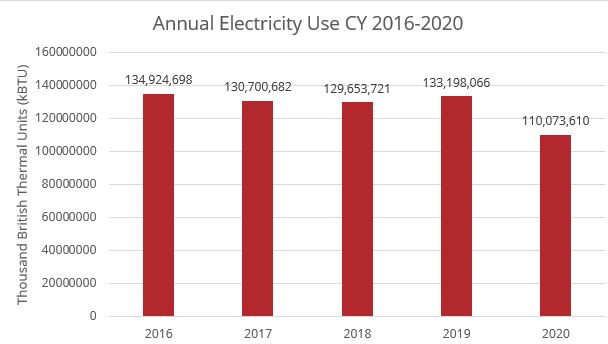
Electricity Use Savings
2020 vs 2016
- 18% decrease in natural gas usage
- $899,000 in savings
2020 vs 2019
- 17% decrease in natural gas usage
- $728,000 in savings
Impact